Showing posts with label Materi Multimedia. Show all posts

11 September 2012

PRINSIP SENI GRAFIS DALAM SAJIAN MULTIMEDIA

Berikut ini adalah contoh gambar poster untuk tugas mata pelajaran Produktif Multimedia kelas XI UPT SMK NEGERI 1 PAsuruan
KD :MENERAPKAN PRINSIP SENI GRAFIS DALAM SAJIAN MULTIMEDIA
SK :Menjelaskan kaidah estetika dan etika seni grafis (nirmana)
Tugas :
1. Amati gambar poster dibawah ini
2. Jelaskan gambar poster tersebut berdasarkan kaidah estetika dan etika seni grafis


Selengkapnya...

Controlling Nodes

Before looking at the various curve tools available in CorelDRAW, we must look at the types of nodes that can be created, and how they are controlled. The figure below shows what a node would look like if selected with the Shape tool. The Shape tool is the standard tool for moving an manipulating nodes. This node pictured is what a cusp node would look like.


Cusp Node
Cusp nodes let you create sharp transitions, such as corners or sharp angles, in a curve object. You can move the control handles in a cusp node independently of one another, changing only the line on one side of the node.
Smooth Nodes
With smooth nodes, the lines passing through the node take on the shape of a curve, producing smooth transitions between line segments. The control handles of a smooth node are always directly opposite one another, but they may be at different distances from the node.
Symmetrical nodes
Symmetrical nodes are similar to smooth nodes. They create a smooth transition between line segments, but they also let you give lines on both sides of a node the same curve appearance. The control handles of symmetrical nodes are directly opposite each other and at an equal distance from the node.
Line Nodes
Line nodes let you shape curve objects by changing the shape of their segments. You can make a curved segment straight or a straight segment curved. Making a straight segment curved does not noticeably change the segment’s appearance, but it displays control handles that you can move to change the segment’s shape.

Selengkapnya...

CorelDRAW terminology and concepts

Before you get started with CorelDRAW, you should be familiar with the following terms.

object An element in a drawing such as an image, shape, line, text, curve, symbol, or layer.
drawing The work you create in CorelDRAW: for example, custom artwork, logos, posters, and newsletters .
vector graphic An image generated from mathematical descriptions that determine the position, length, and direction in which lines are drawn.
bitmap An image composed of grids of pixels or dots.
docker A window containing available commands and settings relevant to a specific tool or task.
flyout A button that opens a group of related tools or menu items
artistic text A type of text to which you can apply special effects, such as shadows.
paragraph text A type of text to which you can apply formatting options, and which can be edited in large blocks.

Selengkapnya...

CorelDRAW application window

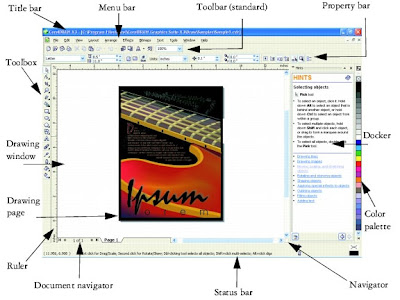
When you launch CorelDRAW, the application window opens containing a drawing window. The rectangle in the center of the drawing window is the drawing page where you create your drawing. Although more than one drawing window can be opened, you can apply commands to the active drawing window only.
The CorelDRAW application window appears below. A description of its parts follows.


Menu bar The area containing pull-down menu options
Property bar A detachable bar with commands that relate to the active tool or object. For example, when the text tool is active, the text property bar displays commands that create and edit text.
Toolbar A detachable bar that contains shortcuts to menu and other commands
Title bar The area displaying the title of the currently open drawing
Rulers Horizontal and vertical borders that are used to determine the size and position of objects in a drawing
Toolbox A floating bar with tools for creating, filling, and modifying objects in the drawing
Drawing window The area outside the drawing page bordered by the scroll bars and application controls
Drawing page The rectangular area inside the drawing window. It is the printable area of your work area.
Color palette A dockable bar that contains color swatches
Docker A window containing available commands and settings relevant to a specific tool or task
Status bar An area at the bottom of the application window that contains information about object properties such as type, size, color, fill, and resolution. The status bar also shows the current mouse position.
Document navigator The area at the bottom left of the application window that contains controls for moving between pages and adding pages
Navigator A button at the lower-right corner that opens a smaller display to help you move around a drawing

Selengkapnya...

09 September 2012

Bit Depth

Just as sample rate determines frequency range, bit depth determines dynamic range. When a sound wave is sampled, each sample is assigned the amplitude value closest to the original wave’s amplitude. Higher bit depth provides more possible amplitude values, producing greater dynamic range, a lower noise floor, and higher fidelity:

Selengkapnya...

Sample rate

Sample rate indicates the number of digital snapshots taken of an audio signal each second. This rate determines the frequency range of an audio file. The higher the sample rate, the closer the shape of the digital waveform is to that of the original analog waveform. Low sample rates limit the range of frequencies that can be recorded, which can result in a recording that poorly represents the original sound.

Two sample rates

A.Low sample rate that distorts the original sound wave.
B.High sample rate that perfectly reproduces the original sound wave.

To reproduce a given frequency, the sample rate must be at least twice that frequency. (See Nyquist frequency.) For example, CDs have a sample rate of 44,100 samples per second, so they can reproduce frequencies up to 22,050 Hz, which is beyond the limit of human hearing, 20,000 Hz.
Here are the most common sample rates for digital audio:

Selengkapnya...

Comparing analog and digital audio

In analog and digital audio, sound is transmitted and stored very differently.
Analog audio: positive and negative voltage
A microphone converts the pressure waves of sound into voltage changes in a wire: high pressure becomes positive voltage, and low pressure becomes negative voltage. When these voltage changes travel down a microphone wire, they can be recorded onto tape as changes in magnetic strength or onto vinyl records as changes in groove size. A speaker works like a microphone in reverse, taking the voltage signals from an audio recording and vibrating to re-create the pressure wave.

Digital audio: zeroes and ones
Unlike analog storage media such as magnetic tape or vinyl records, computers store audio information digitally as a series of zeroes and ones. In digital storage, the original waveform is broken up into individual snapshots called samples. This process is typically known as digitizing or sampling the audio, but it is sometimes called analog-to-digital conversion.
When you record from a microphone into a computer, for example, analog-to-digital converters transform the analog signal into digital samples that computers can store and process.

Selengkapnya...

How sound waves interact

When two or more sound waves meet, they add to and subtract from each other. If their peaks and troughs are perfectly in phase, they reinforce each other, resulting in a waveform that has higher amplitude than either individual waveform.


In phase waves reinforce each other.

If the peaks and troughs of two waveforms are perfectly out of phase, they cancel each other out, resulting in no waveform at all.

Out of phase waves cancel each other out.
In most cases, however, waves are out of phase in varying amounts, resulting in a combined waveform that is more complex than individual waveforms. A complex waveform that represents music, voice, noise, and other sounds, for example, combines the waveforms from each sound together.
Because of its unique physical structure, a single instrument can create extremely complex waves. That’s why a violin and a trumpet sound different even when playing the same note.

Two simple waves combine to create a complex wave

Selengkapnya...

Waveform Measurements

Several measurements describe waveforms:
Amplitude
Reflects the change in pressure from the peak of the waveform to the trough. High-amplitude waveforms are loud; low-amplitude waveforms are quiet.
Cycle
Describes a single, repeated sequence of pressure changes, from zero pressure, to high pressure, to low pressure, and back to zero.

Frequency
Measured in hertz (Hz), describes the number of cycles per second. (For example, a 1000-Hz waveform has 1000 cycles per second.) The higher the frequency, the higher the musical pitch.

Phase
Measured in 360 degrees, indicates the position of a waveform in a cycle. Zero degrees is the start point, followed by 90º at high pressure, 180º at the halfway point, 270º at low pressure, and 360º at the end point.

Wavelength
Measured in units such as inches or centimeters, is the distance between two points with the same degree of phase. As frequency increases, wavelength decreases

A single cycle at left; a complete, 20-Hz waveform at right

A.Wavelength
B.Degree of phase
C.Amplitude
D.One second

Selengkapnya...

Sound Fundamentals

Sound starts with vibrations in the air, like those produced by guitar strings, vocal cords, or speaker cones. These vibrations push nearby air molecules together, raising the air pressure slightly. The air molecules under pressure then push on the air molecules surrounding them, which push on the next set of molecules, and so on. As high-pressure areas move through the air, they leave low-pressure areas behind them. When these waves of pressure changes reach us, they vibrate the receptors in our ears, and we hear the vibrations as sound.

When you see a visual waveform that represents audio, it reflects these waves of air pressure. The zero line in the waveform is the pressure of air at rest. When the line swings up to a peak, it represents higher pressure; when the line swings down to a trough, it represents lower pressure.


A sound wave represented as a visual waveform

A.Zero line
B.Low-pressure area
C.High-pressure area

Selengkapnya...

27 August 2012

KUMPULAN MATERI MULTIMEDIA SMK

Berikut adalah kumpulan materi multimedia dari Blog Pak Kurnia Yahya lengkap beserta RPP dan KBM, beberapa SK masih perlu disusun kembali bahkan masih dalam versi english.

Sumber Resmi : http://odisumantri.wordpress.com

Selengkapnya...
Template by : kendhin x-template.blogspot.com